Key Takeaways
- Bitcoin held above $78K on May 17 as BTC traders monitored resistance near $79K.
- Technical metrics highlight mixed BTC signals, with MACD Sell pressure offset by RSI neutrality.
- Market data shows BTC volume at $19.84B as markets watched the $77.4K support zone.
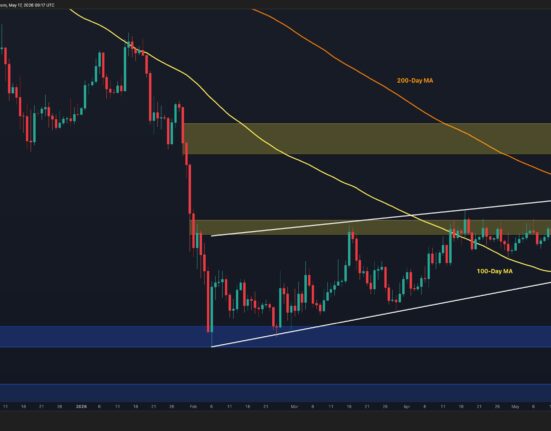
Bitcoin Chart Outlook
On the 1-hour chart, bitcoin displayed modest recovery attempts following the move down toward the $77,600 low, with higher lows beginning to develop during a low- volatility session. Immediate support formed near $77,800, while resistance remained between $78,600 and $79,000.
Volume stayed relatively light, signaling that traders were still waiting for stronger confirmation before positioning aggressively in either direction. Analysts monitoring intraday momentum noted that a breakout above $79,000, accompanied by stronger participation, could strengthen bullish momentum, while a rejection near resistance would likely maintain the current consolidation structure.

The 4-hour chart reflected a market attempting to stabilize after a period of stronger bearish pressure earlier in the week. Price action formed a developing base between $77,600 and $78,000 as multiple small-bodied candles highlighted indecision and cooling selling momentum.
Technical levels showed resistance targets at $79,500 and $80,800, while invalidation for bullish setups remained below $77,400. The broader swing structure suggested bitcoin was transitioning from aggressive downside momentum into a neutral consolidation phase, with traders closely watching whether support levels could continue absorbing selling pressure.

On the daily chart, bitcoin maintained a broader uptrend despite the recent corrective move from the $82,800 peak. Current price action continued testing the $78,000 to $79,000 demand zone, which market participants viewed as a key area for preserving bullish structure.
Resistance levels remained positioned near $79,500, $81,000, and the recent $82,800 high, while downside support extended toward $76,500 and $75,000. The broader market structure still favored bullish continuation above $78,000, although a daily close below $76,500 could weaken sentiment and increase the likelihood of a deeper retracement toward the mid-$74,000 range.

Oscillator readings this weekend reflected largely neutral momentum conditions across the market. The relative strength index ( RSI) stood at 49, while the Stochastic measured 15, both signaling neutral market conditions. The commodity channel index (CCI) registered a negative 54, and the average directional index (ADX) printed 28, reinforcing the absence of a dominant directional trend.
Meanwhile, the Awesome oscillator remained neutral at 1,253, momentum generated a bullish signal at negative 1,736, and the moving average convergence divergence ( MACD) level issued a bearish signal at 958. Collectively, oscillators indicated mixed market sentiment without a decisive directional bias.
Moving averages (MAs) also highlighted conflicting technical conditions between short-term weakness and longer-term support. The exponential moving average (EMA) 10 at 79,489, the simple moving average (SMA) 10 at 80,112, EMA 20 at 79,051, and SMA 20 at 79,360 all generated bearish signals as bitcoin traded below those levels.
However, the EMA 30 at 78,170 and several longer-duration averages, including the EMA 50 at 76,751, SMA 50 at 75,440, EMA 100 at 76,873, and SMA 100 at 72,148, continued issuing positive signals. Longer-term resistance remained concentrated around the EMA 200 at 81,876 and SMA 200 at 81,594, both of which maintained negative ratings. Overall, the moving average structure reflected a market consolidating within a broader bullish trend while short-term momentum remained cautious.
Bull Verdict:
Bitcoin’s broader structure remains constructive as long as BTC holds above the $78,000 support zone, with longer-term moving averages still favoring upside continuation toward the $80,000 to $82,800 resistance range. Stabilizing momentum on the 4-hour and daily charts, combined with cooling bearish pressure, suggests bulls retain control if volume strengthens on a breakout above $79,000.
Bear Verdict:
Bitcoin remains vulnerable to deeper downside if support between $77,500 and $78,000 fails decisively, especially with the MACD Level still flashing a bearish signal and short-term moving averages trending negative. A confirmed breakdown below $77,400 to $76,500 could weaken the broader bullish trend and expose BTC to additional downside toward the $74,000 to $75,000 region.