
Bitcoin Chart Outlook
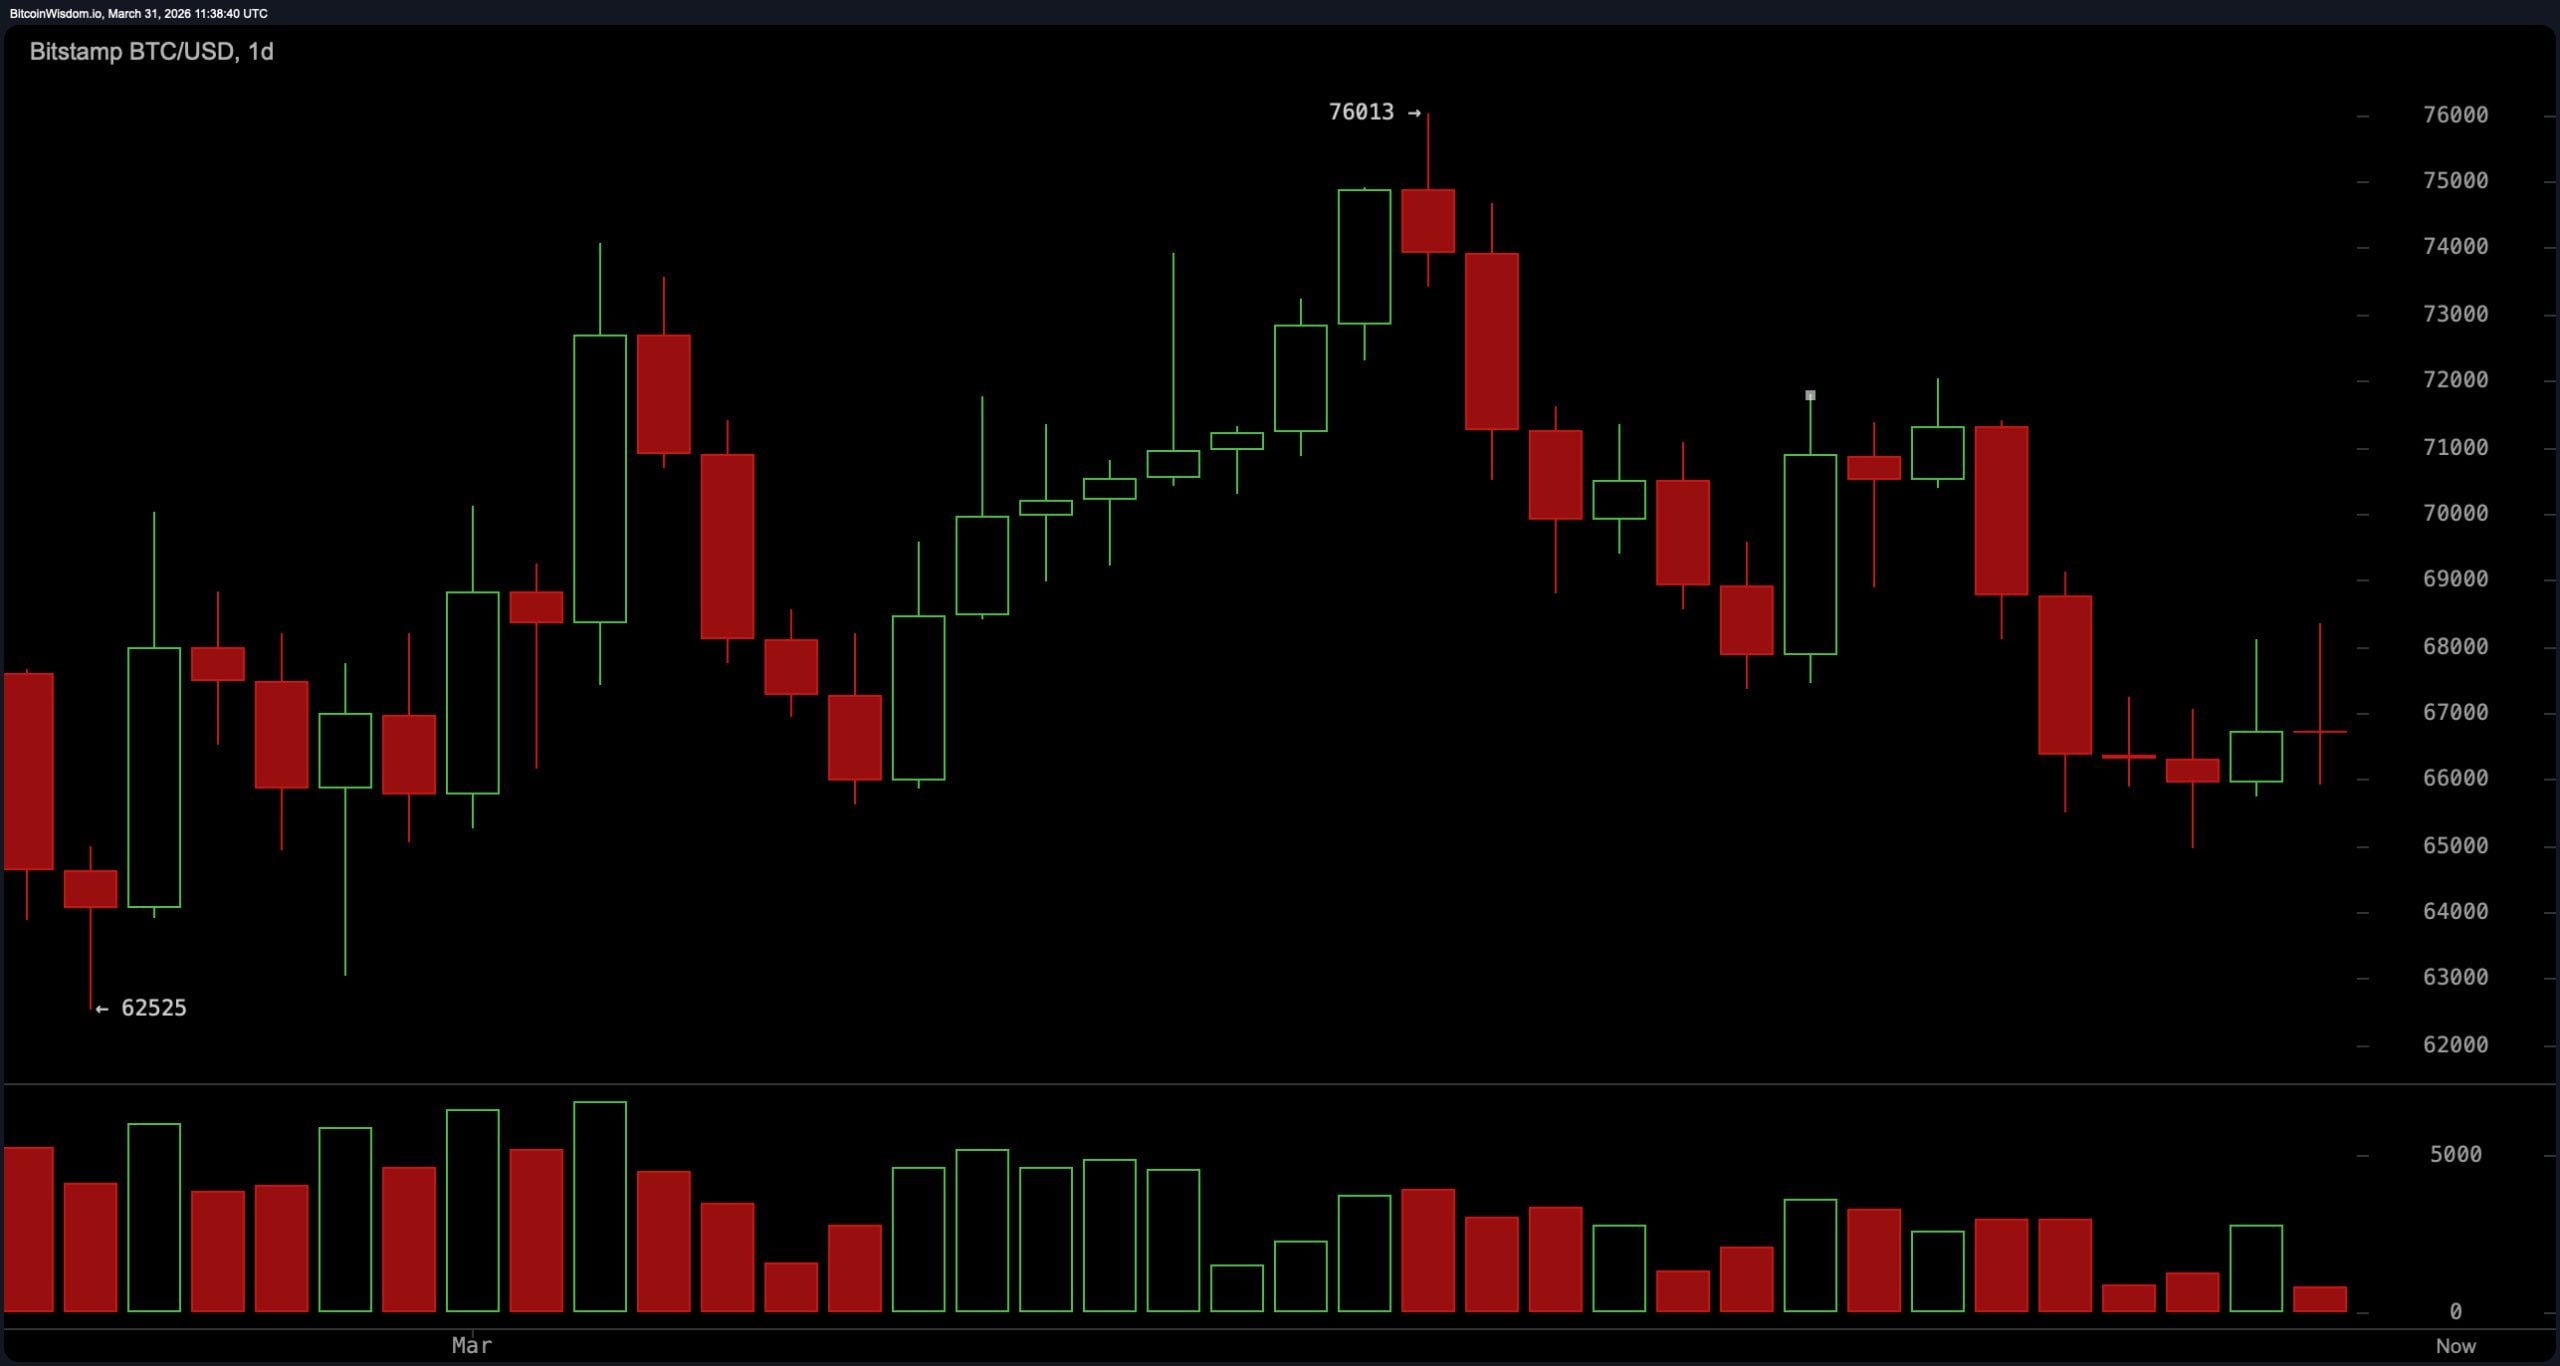
The daily bitcoin chart reflects a market transitioning out of a prior bullish structure into a more neutral-to- bearish posture. Price action has rolled over from a lower high near the mid-$70,000s and is now drifting in the mid-$60,000 range, indicating fading upside momentum.
Key resistance remains concentrated between $71,000 and $73,000, while intermediate resistance sits near $68,000 to $69,000. Support is holding at $65,000 to $66,000, but a sustained move below $64,000 would signal a broader structural breakdown. The daily trend no longer supports directional conviction, instead suggesting distribution characteristics.
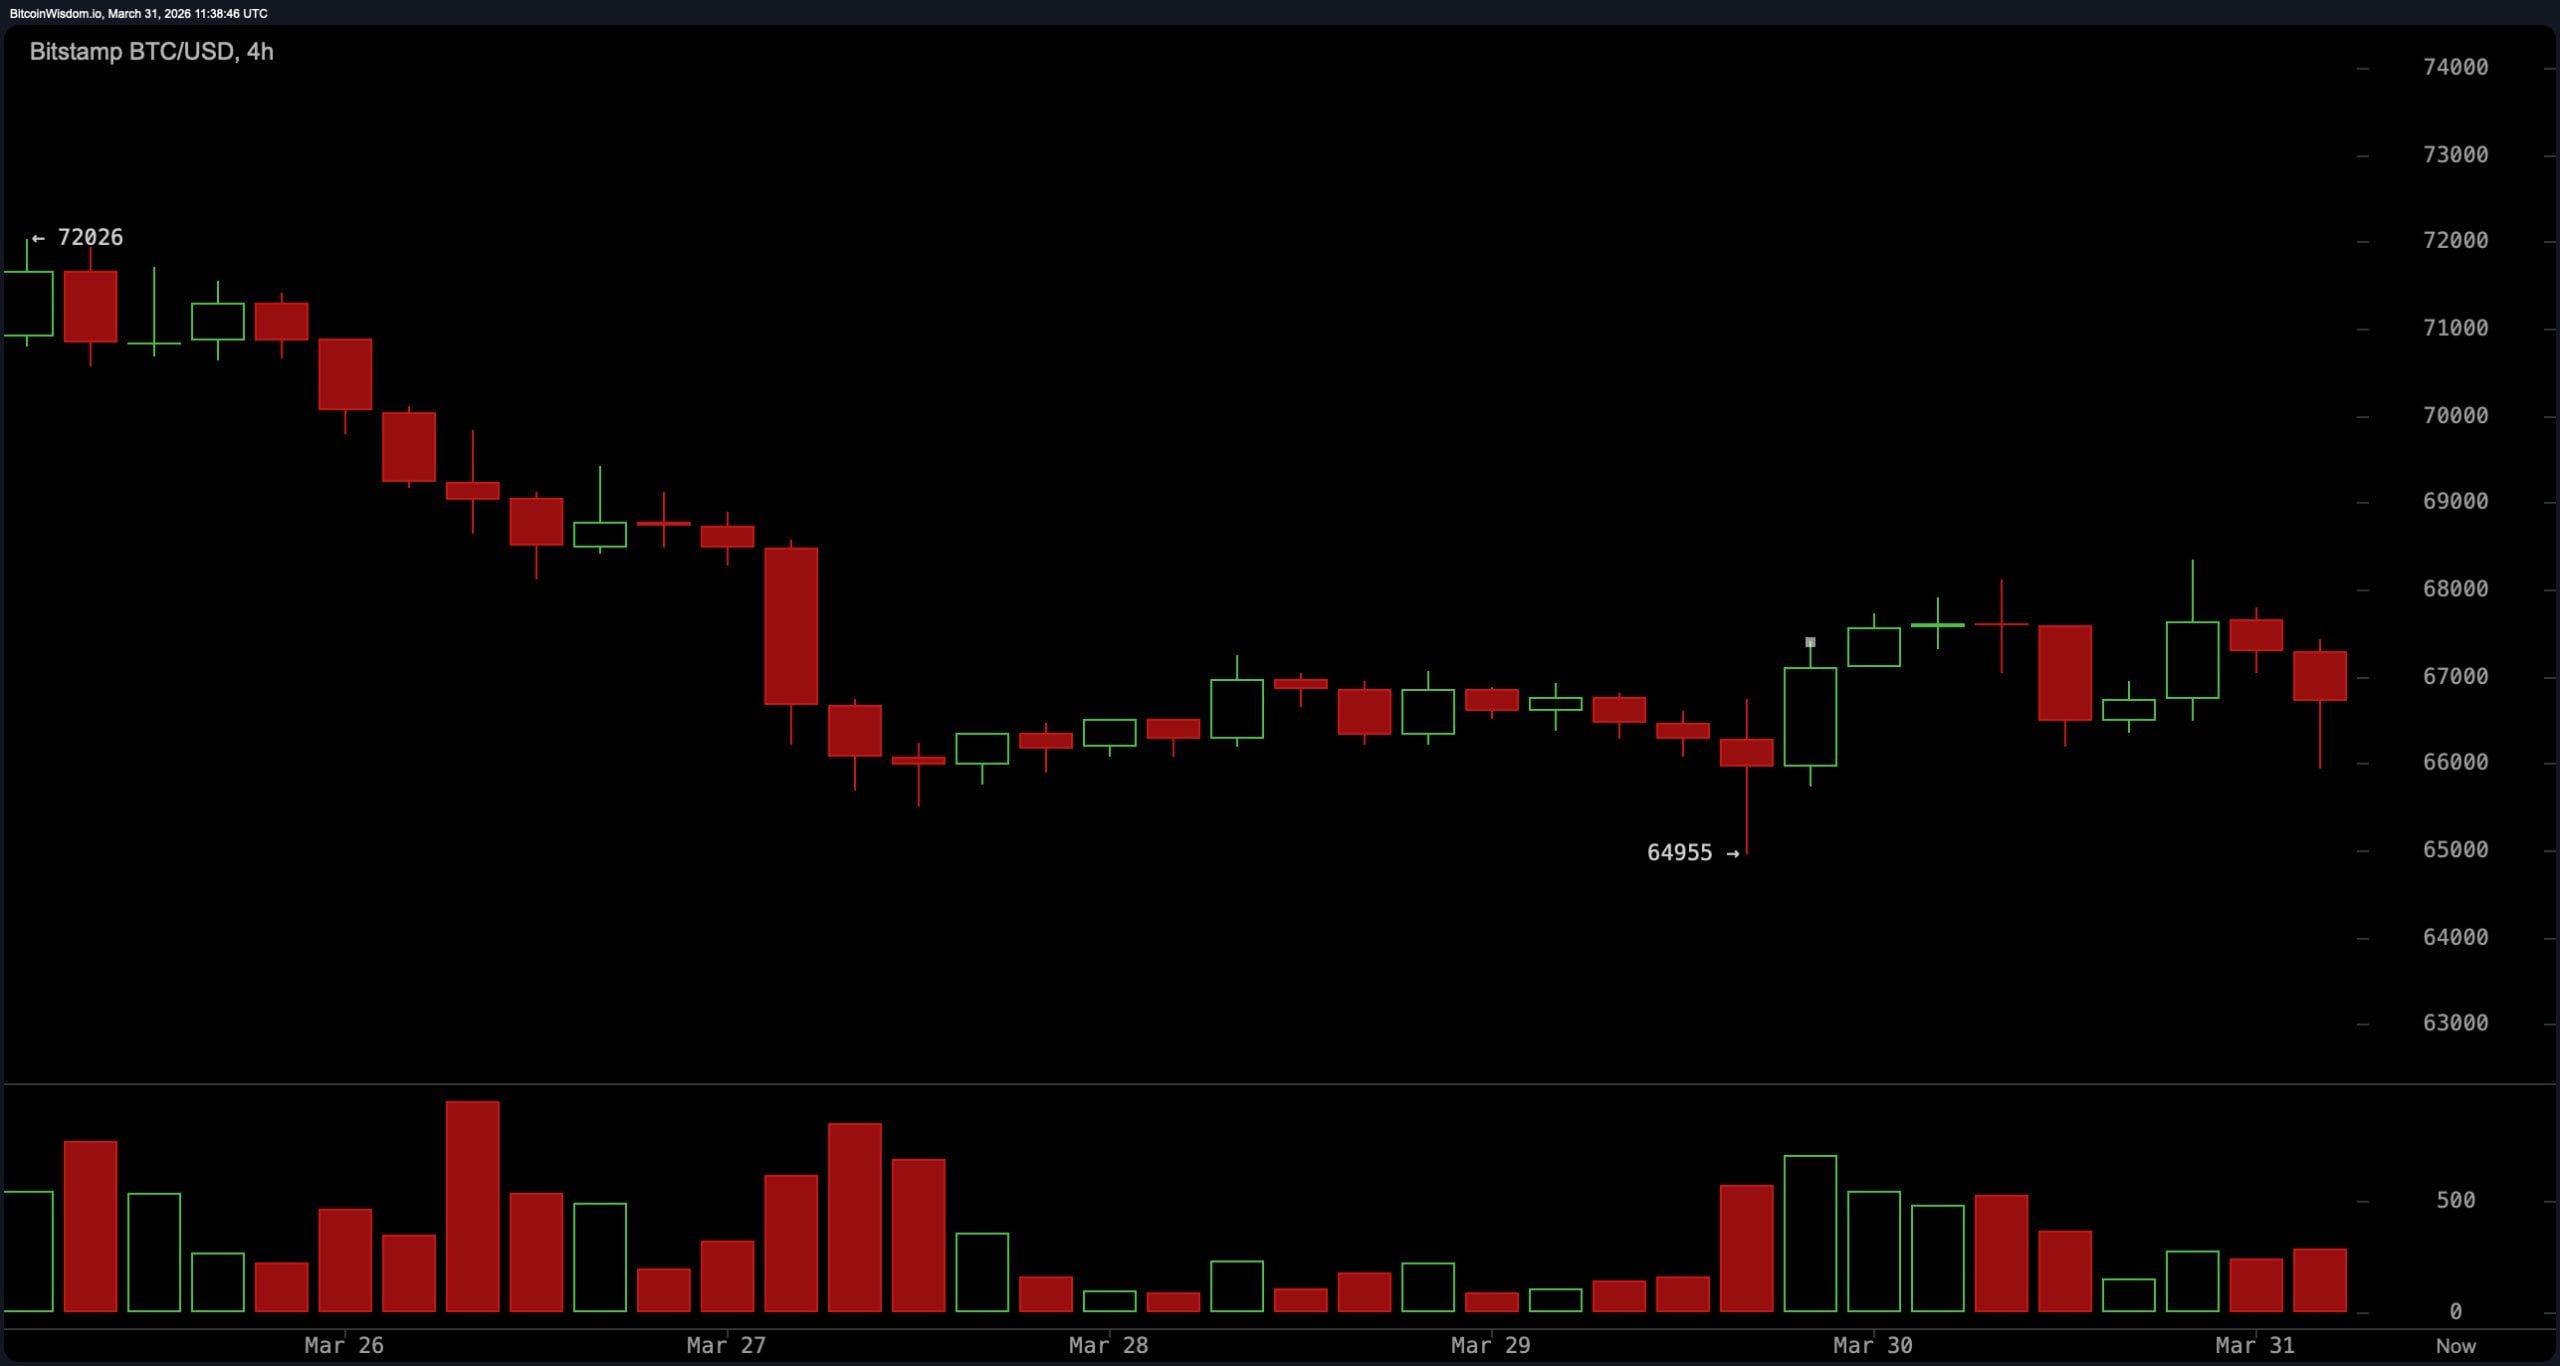
On the four-hour timeframe, bitcoin shows a clear transition from downtrend into consolidation. Price established a higher low near $65,000, but the subsequent bounce lacks strength and continues to stall below the $68,000 to $69,000 resistance cluster. This compression reflects a market coiling without decisive participation. Support remains firm at $65,000, with a breakdown trigger just below $64,900. The structure suggests a range-bound environment, with repeated failures at resistance reinforcing seller presence despite short-term stabilization attempts.
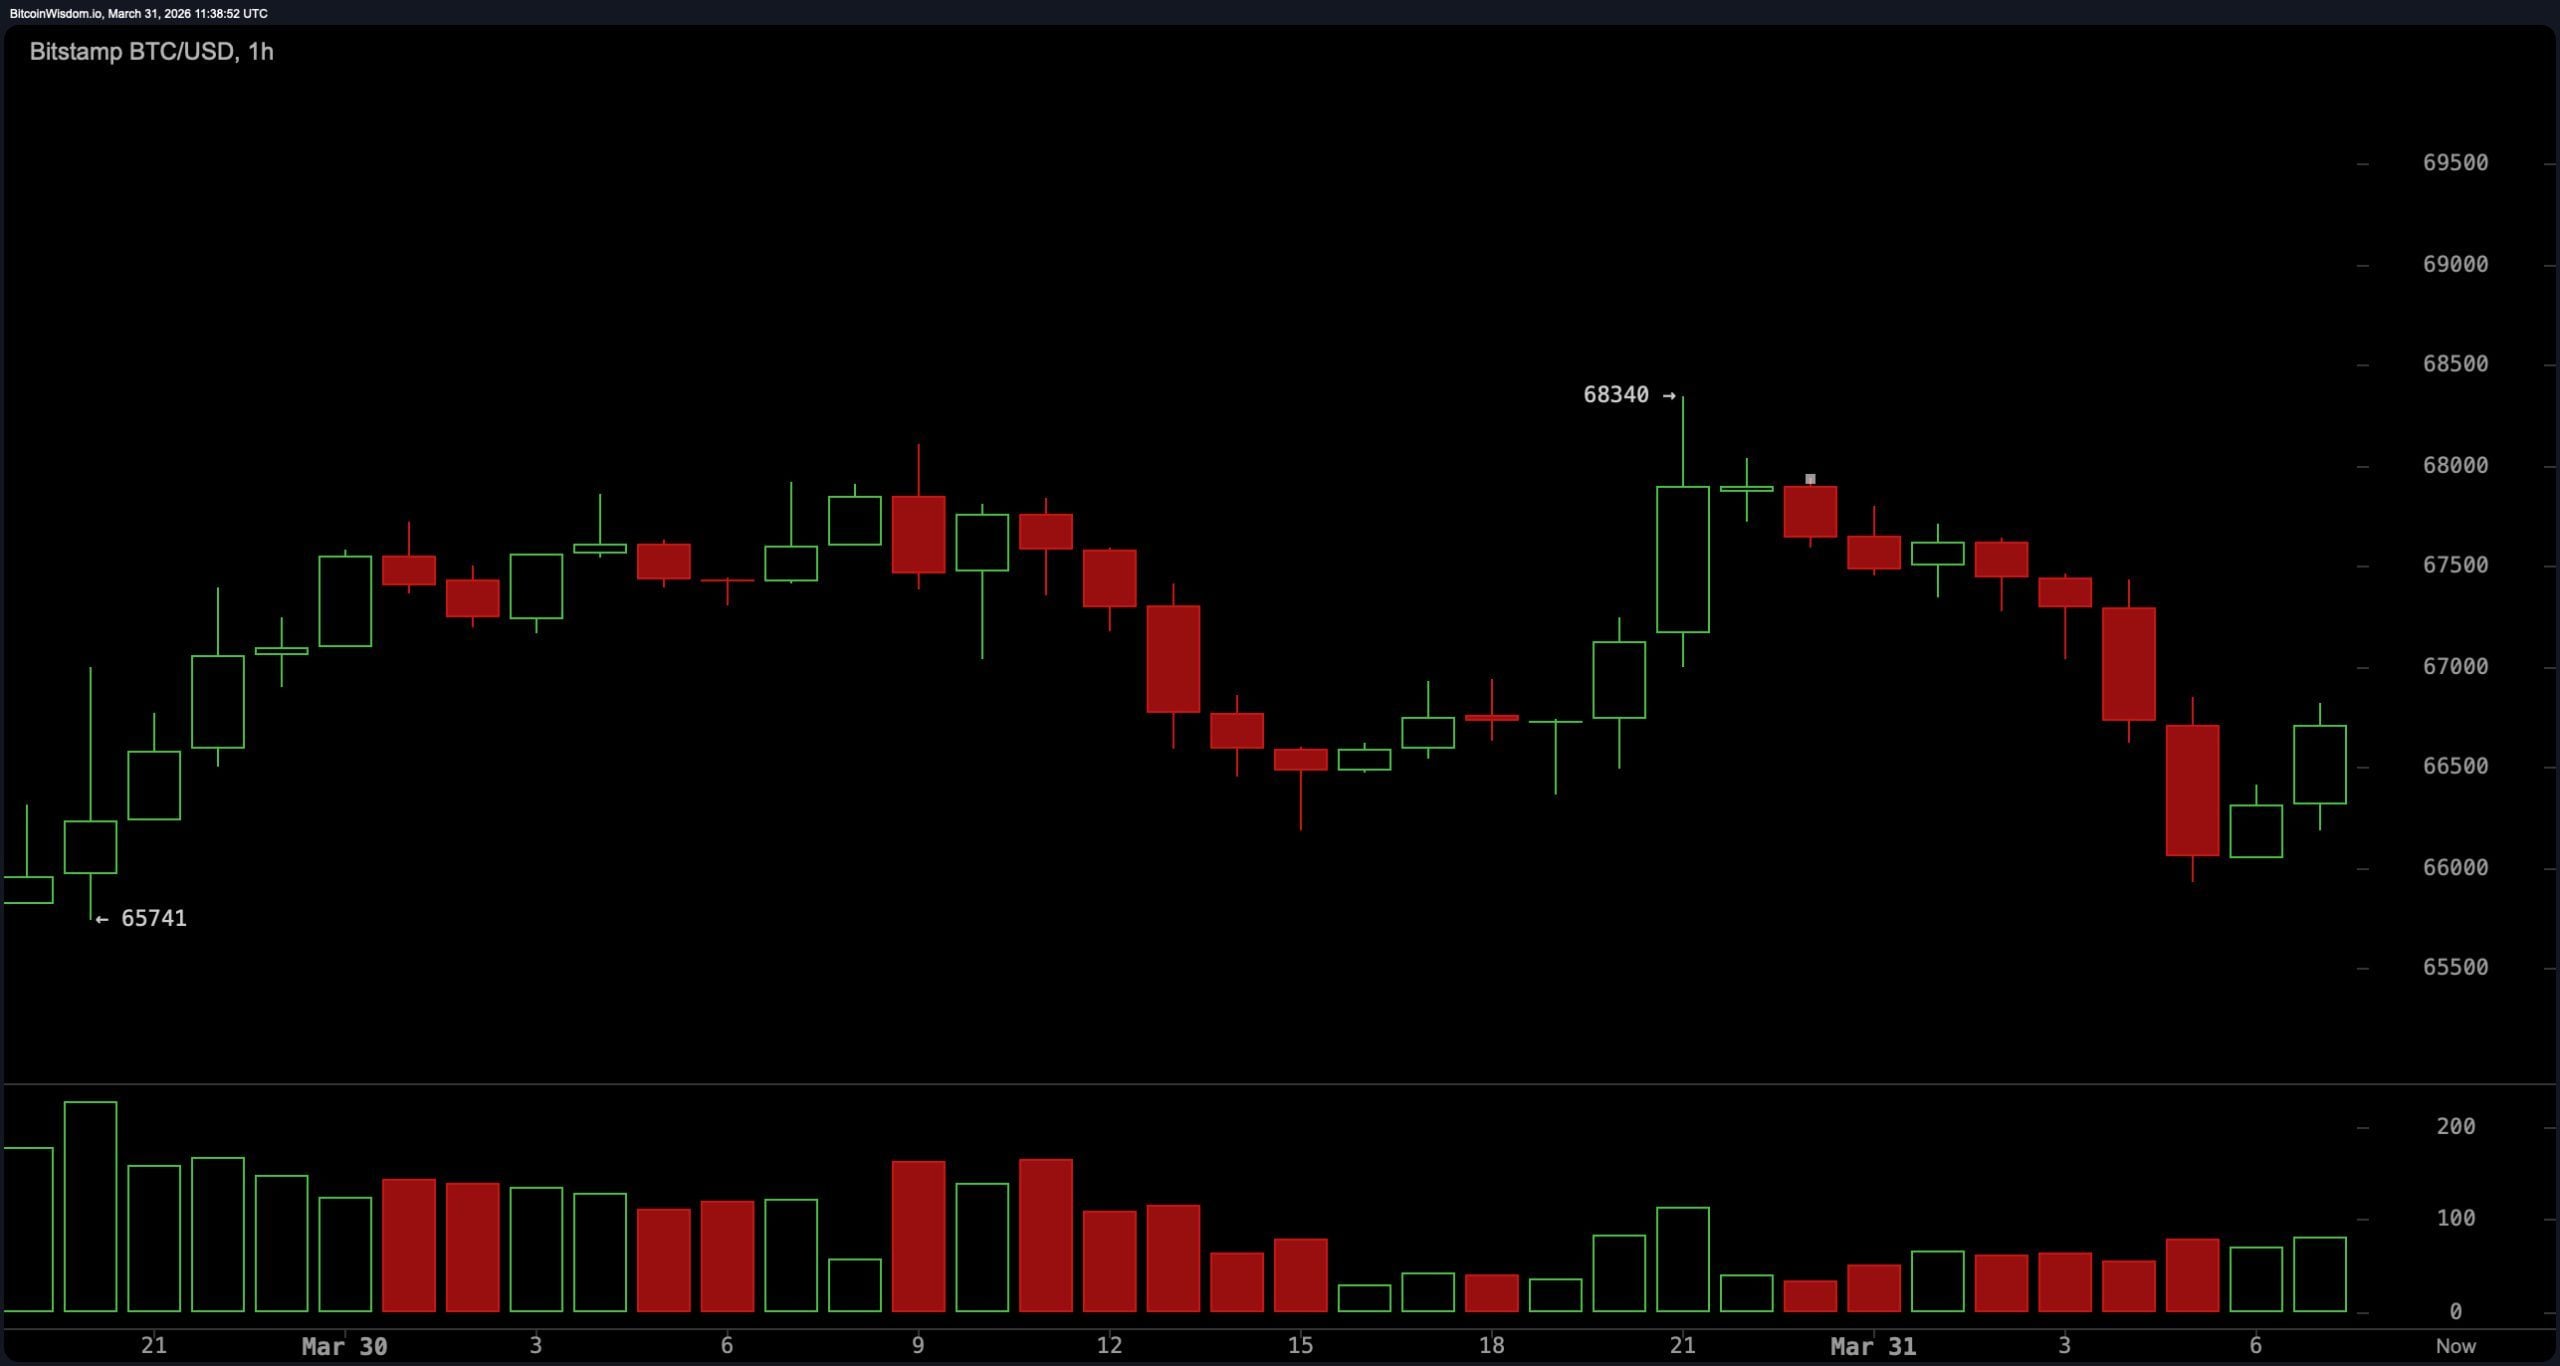
The one-hour bitcoin chart highlights weak short-term momentum, with lower highs still intact and price action drifting sideways with a slight bearish tilt. A modest bounce from the $66,000 region has failed to generate follow-through, reinforcing the lack of aggressive buying pressure. Microstructure remains fragile, with price oscillating tightly and no clear breakout pattern forming. This timeframe points to the broader narrative: consolidation with downside risk unless resistance is convincingly reclaimed.
Oscillators present a mixed but generally uninspiring picture. The relative strength index ( RSI) at 42 reflects subdued momentum, while the Stochastic and average directional index (ADX) confirm the absence of a strong trend.
The commodity channel index (CCI) at −104 and the momentum indicator suggest short-term reactive strength, but these signals lack confirmation from broader indicators. The moving average convergence divergence ( MACD) remains negative at −947, reinforcing underlying bearish pressure despite intermittent counter-moves. Overall, oscillators align with a neutral stance, skewed slightly toward weakness.
Moving averages (MAs) deliver the most decisive signal—and it is not subtle. The exponential moving average (EMA) and simple moving average (SMA) across all key periods remain above the current price, indicating persistent downside pressure.
Short-term levels, including the 10 EMA ($67,832) and 10 SMA ($68,138), cap upside attempts, while longer-term measures such as the 50 EMA ($71,005), 100 EMA ($76,713), and 200 EMA ($85,095) reinforce the broader bearish structure. With price trading below every major EMA and SMA, the trend remains technically constrained, and any upside movement continues to face layered resistance overhead.
Bull Verdict:
A sustained break and hold above the $68,000 to $69,000 resistance cluster, supported by rising volume and momentum confirmation, would invalidate the current compression narrative and signal a short-term structural shift toward recovery, with potential to challenge higher resistance bands.
Bear Verdict:
Continued rejection below $68,000 combined with a breakdown under $65,000, particularly through the $64,800 region, would confirm bearish continuation, aligning with dominant moving average pressure and opening the path toward lower support zones in the low-$60,000 range.
FAQ 🧭
- What is bitcoin’s price outlook on March 31, 2026?
Bitcoin remains range-bound near $67,000 with neutral-to- bearish technical signals dominating. - Is bitcoin in a bullish or bearish trend right now?
Bitcoin is currently in a consolidation phase with a slight bearish bias due to overhead resistance and weak momentum. - What are the key support and resistance levels for bitcoin?
Key support sits at $65,000–$66,000, while resistance is concentrated at $68,000–$69,000. - What do bitcoin’s technical indicators suggest?
Oscillators are mostly neutral, but moving averages signal sustained downside pressure.