
TL;DR
- Ethereum mirrors global liquidity trends, exiting accumulation and entering a potential long-term bull phase.
- $4,520 remains a key resistance level for ETH; a breakout could trigger a rally toward $4,800 or higher.
- September may be weak, but Q4 often flips bullish, averaging gains across October to December.
Ethereum Moves With Global Liquidity Shift
Ethereum is showing a pattern that closely tracks the movement of global M2 liquidity. A chart shared by analyst Merlijn The Trader shows the price of ETH rising alongside broader liquidity growth.
Interestingly, the accumulation zone, marked below the $2,750 level, appears to have ended, as ETH enters a new phase labeled “Bull Run” on the chart. Merlijn said,
“Accumulation is done. The bull run is alive,” and added, “This isn’t hopium, it’s macro.”
The chart shows both ETH and liquidity moving higher, suggesting that Ethereum is responding to shifts in the broader money supply.
ETHEREUM IS TRACKING GLOBAL LIQUIDITY
Accumulation is done.
The bull run is alive.Global liquidity is expanding higher and $ETH is mirroring the move.
This isn’t hopium, it’s macro.Miss it now, and you’ll be chasing above $6K. pic.twitter.com/Ggc2p5GxDS
— Merlijn The Trader (@MerlijnTrader) August 31, 2025
Ethereum is trading just below a key resistance level at $4,520. Analyst Lennaert Snyder posted a liquidity heatmap that shows a high concentration of sell orders around that zone.
“ETH liquidity laying around key $4,520 resistance. Could Ethereum reclaim it today?” he asked.
A move through this level could open the way for further upside, but failure to clear it may result in short-term pullbacks.
Market Awaits Breakout From Triangle Pattern
On the 4-hour chart, Ethereum is compressing inside a symmetrical triangle. This pattern has been developing for over 10 days. Snyder pointed out that a breakout is likely soon, given the narrowing price range.
$ETH about to choose a direction.
It’s in compression for 10 days now, a breakout should happen soon.
If Ethereum breaks out upwards, we probably go for the $4,800 rangehigh.
A downward breakout leads ~$4,000 as first support level. pic.twitter.com/PckkgSVoaM
— Lennaert Snyder (@LennaertSnyder) September 1, 2025
A breakout to the upside would put $4,837 in play as the next target. If the asset breaks downward, the first support area is near $4,071, followed by additional zones at $3,900 and $3,700. These levels could attract buyers if the price moves lower.
Seasonal History Shows Mixed Outlook
Past data suggests that September has often been a weak month for Ethereum. Analyst Cipher X noted the average return for September is -6.1%. Years like 2020 and 2022 saw double-digit drops, though 2021 saw a strong rally.
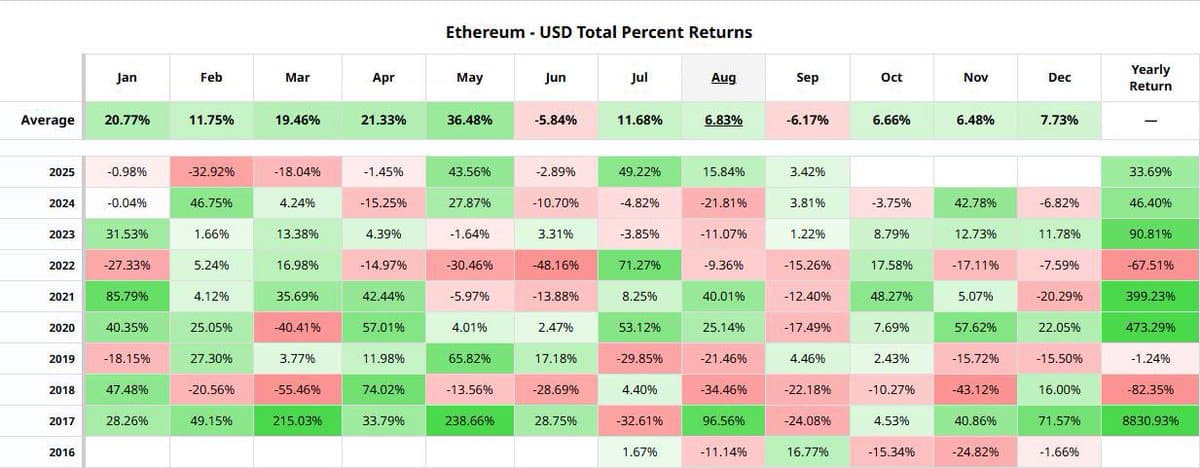
Cipher said,
“September might be choppy but the months that follow have usually been much friendlier to ETH.”
October, November, and December have often seen price recoveries, with average returns of over 6% in each of those months.
Ethereum now sits at a critical point, with both macro and technical factors suggesting a move is near.
Binance Free $600 (CryptoPotato Exclusive): Use this link to register a new account and receive $600 exclusive welcome offer on Binance (full details).
LIMITED OFFER for CryptoPotato readers at Bybit: Use this link to register and open a $500 FREE position on any coin!